Plot raster image centered at `x` and `y` coordinates scaled to diameter `d`.
Arguments
- x, y
coordinates
- image
raster image
- d
**optional** diameter, see details
- dx, dy
**optional** diameter in either coordinate direction
- rotate
**optional** clockwise rotation in degrees (0-360°)
- ...
**optional** other parameters passed to [graphics::rasterImage()], such as `interpolate`
Details
The `rasters()` function is a convenient wrapper around [graphics::rasterImage()] with similar interface to the [Shapes] functions available in this package (such as [square()], [circle()] and [rcpoly()]).
The raster image is plotted centered at the `x` and `y` coordinates and scaled to the diameter size `d`. When `dx` and `dy` are `NA`, the proportions of the raster are kept unchanged, otherwise they are scaled to the specified size in either direction. This scaling is done before rotation.
Unlike in `rasterImage`, the rotation is performed clockwise and the rotation axis is the center of the raster (i.e., the provided x and y coordinates), rather than the bottom left coordinate `x0`. This rotation is performed after scaling.
As of yet, the rotation is accurate only when the aspect ratio is set to 1 (`asp=1`) through the `graphics::plot.window()` call.
The `rasters()` function is fully vectorized.
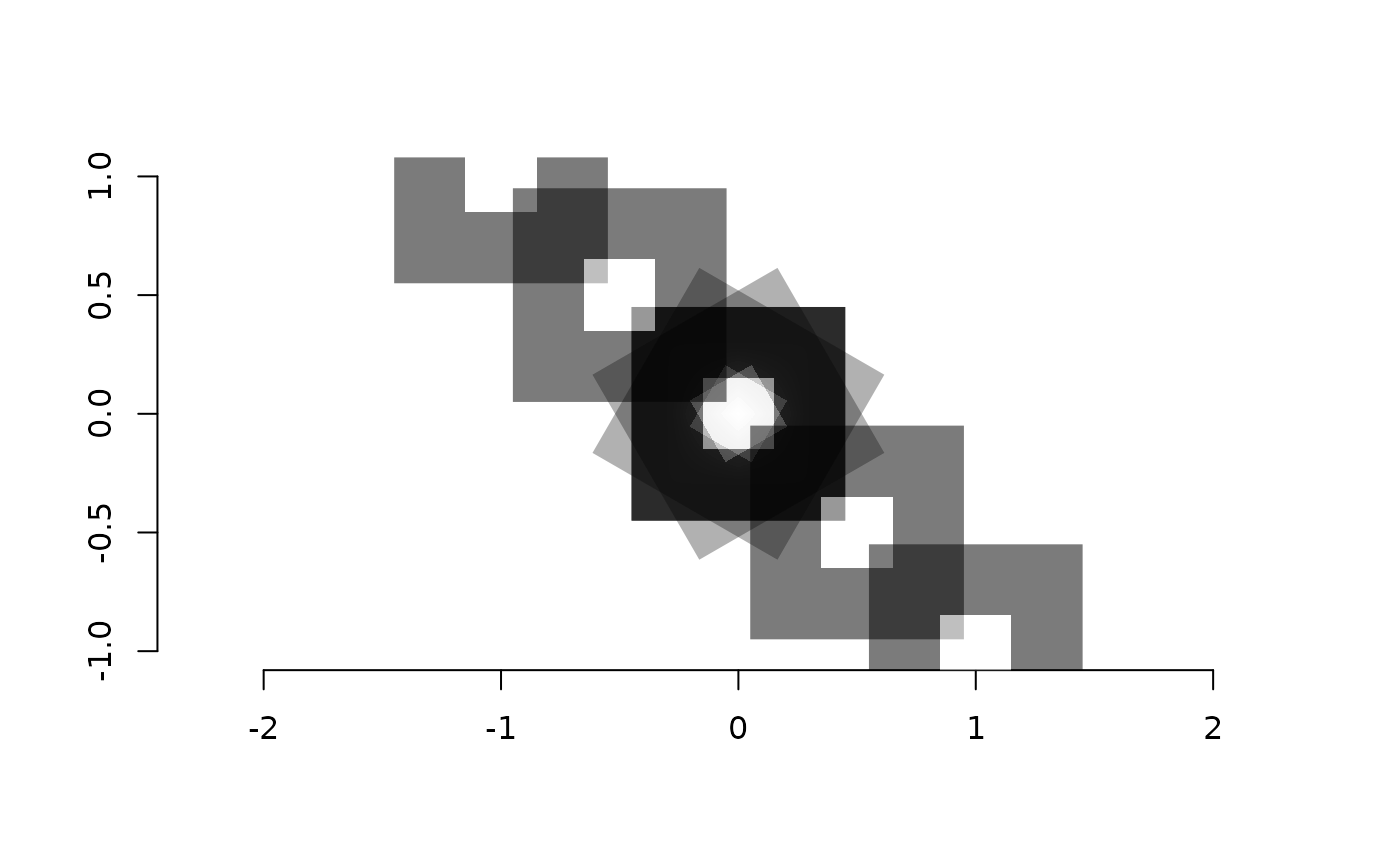
Examples
# create plotting window
plot.new(); plot.window(c(-1,1), c(-1,1), asp=1); axis(1); axis(2)

# create raster image, alpha is convenient when overplotting
img = matrix(adjustcolor("black", alpha.f=0.3), 3, 3)
img[2, 2] = adjustcolor("white", alpha.f=0.3)
img = as.raster(img)

rasters(0, 0, img)

# interpolate=FALSE makes quite a difference
rasters(0, 0, img, interpolate=FALSE)

# arguments are vectorized, standard recycling rules apply
rasters(0, 0, img, interpolate=FALSE, rotate=c(30, 60, 90))
rasters(c(-1, -0.5,  0.5, 1), c(1, 0.5, -0.5, -1), img, interpolate=FALSE)